
A New Perspective on the US-China AI Race: 2025 Ollama Deployment Comparison and Global AI Model Trend Insights
Ollama is a prominent open-source toolkit engineered to streamline the local execution, creation, and distribution of Large Language Models (LLMs). It encapsulates model weights, configurations, and associated data within a `Modelfile`-defined package, exposing an API for programmatic interaction with these models. This architecture empowers developers and researchers to efficiently deploy and experiment with a diverse range of advanced AI models on local workstations or server infrastructure.
1. Introduction
Ollama is a prominent open-source toolkit engineered to streamline the local execution, creation, and distribution of Large Language Models (LLMs). It encapsulates model weights, configurations, and associated data within a Modelfile-defined package, exposing an API for programmatic interaction with these models. This architecture empowers developers and researchers to efficiently deploy and experiment with a diverse range of advanced AI models on local workstations or server infrastructure.
This report endeavors to elucidate deployment metrics, model selection patterns, geo-distribution, and network infrastructure characteristics by analyzing telemetry from 174,590 globally deployed Ollama instances.
Note: Data statistics presented in Section 5 and Section 7 are derived from the full dataset of 174,590 instances. Data in Section 6 is sourced from instances with accessible APIs. For security operational reasons (SecOps), Ollama version distribution statistics have been omitted.
Data Snapshot Date: 2025-04-24
Report Origin: Tenthe AI (https://tenthe.com)
Author: Ryan
2. Executive Summary
This report synthesizes findings from network scan data and API endpoint interrogation of publicly accessible Ollama instances worldwide. Key findings include:
Globally, from an initial corpus of approximately 174,590 records identified via Fofa (99,412 unique IP addresses), 41,021 Ollama instances with reachable APIs were successfully probed, distributed across 24,038 unique IP addresses (an effective API accessibility rate of approximately 24.18%).
Geographically, the United States and China exhibit the highest density of Ollama deployments. Cloud Service Providers (CSPs), notably AWS, Alibaba Cloud, and Tencent Cloud, constitute the primary hosting infrastructure for Ollama instances.
Model deployment analysis reveals diversity, with
llama3,deepseek-r1,mistral, andqwenseries models demonstrating widespread adoption. Among these,llama3:latestanddeepseek-r1:latestare the two most frequently deployed model tags.Models with 7B-8B parameters exhibit highest user adoption, while 4-bit quantized models, such as Q4_K_M and Q4_0, are extensively utilized for their optimal trade-off between performance and resource utilization.
The default port
11434is predominantly utilized, and a majority of instances expose services via the HTTP protocol.
3. Data Sources and Methodology
The dataset for this report was compiled through a two-stage process:
Initial Discovery Scan: Utilization of public network scanning platforms (e.g., Fofa) with the query
app="Ollama" && is_domain=falsefor initial discovery of candidate Ollama instances deployed globally. This stage yielded 174,590 records, corresponding to 99,412 unique IP addresses post-deduplication.API Validation and Data Enrichment: Systematic probing of the
ip:port/api/tagsAPI endpoint for the initially identified IP addresses to validate Ollama service reachability and retrieve deployed AI model manifests. This stage confirmed 41,021 successfully responsive Ollama instances (originating from 24,038 unique IPs, with data persisted to theollamatable).The final aggregated dataset is stored in the
ollamarelational table.
The analysis presented herein is primarily based on data from the ollama table, which contains records from successfully probed API endpoints, including IP address, port, geo-location, and the JSON payload (containing the model list), among other attributes.
4. Overall Deployment Statistics
Number of initial records from Fofa scan: 174,590
Number of unique IPs from Fofa initial scan: 99,412
Number of Ollama instances successfully responding to
/api/tags: 41,021 (derived from records wherestatus = 'success'in theollamatable)Number of corresponding unique IP addresses: 24,038 (derived from records where
status = 'success'in theollamatable)Ratio of accessible IPs to initially identified IPs: (24038 / 99412) * 100% ≈ 24.18%
This indicates that among all Ollama instances discovered via Fofa, approximately a quarter expose the /api/tags endpoint publicly, enabling retrieval of information regarding their deployed model configurations.
5. Geographical Distribution Analysis
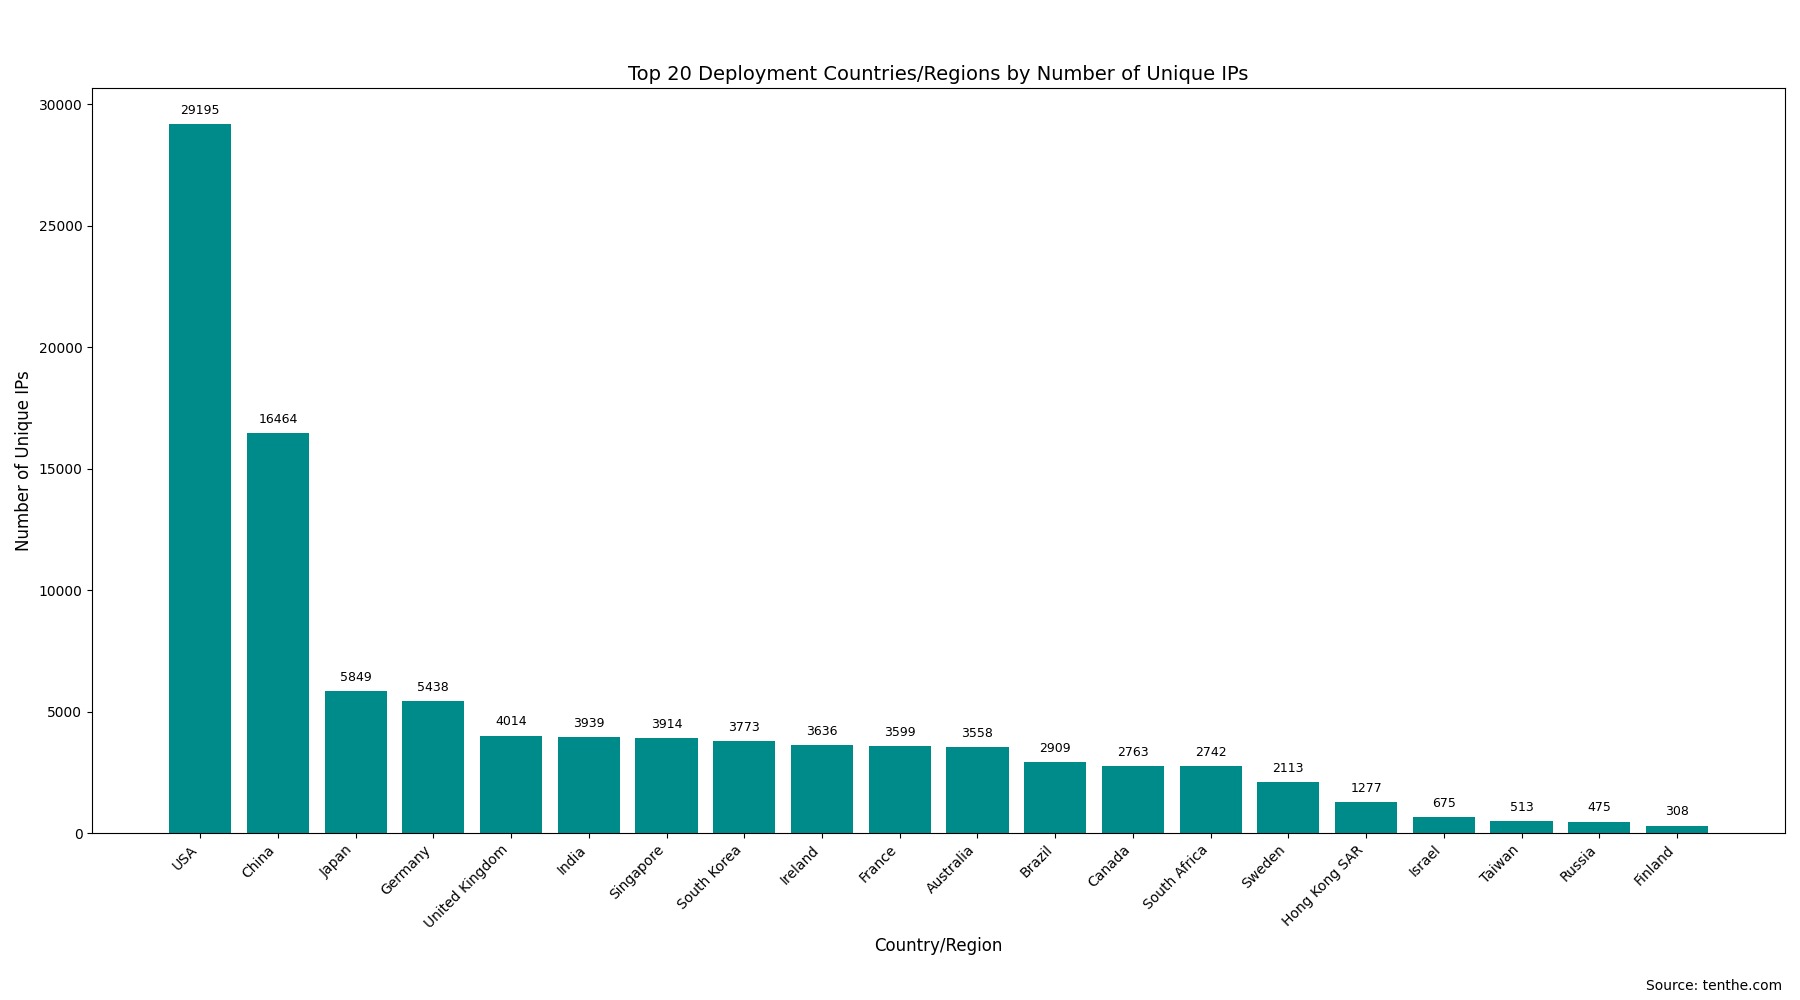
5.1 Top 20 Deployment Countries/Regions
The following table presents the top 20 countries/regions ranked by the count of unique IP addresses hosting Ollama instances.
Rank | Country/Region | Unique IP Count |
|---|---|---|
1 | United States | 29195 |
2 | China | 16464 |
3 | Japan | 5849 |
4 | Germany | 5438 |
5 | United Kingdom | 4014 |
6 | India | 3939 |
7 | Singapore | 3914 |
8 | South Korea | 3773 |
9 | Ireland | 3636 |
10 | France | 3599 |
11 | Australia | 3558 |
12 | Brazil | 2909 |
13 | Canada | 2763 |
14 | South Africa | 2742 |
15 | Sweden | 2113 |
16 | Hong Kong SAR, China | 1277 |
17 | Israel | 675 |
18 | Taiwan, China | 513 |
19 | Russia | 475 |
20 | Finland | 308 |
5.2 Top 20 Global City Deployments
The table below shows the top 20 cities worldwide, ranked by the number of unique IPs with Ollama instances.
Rank | City | Country/Region | Unique IP Count |
|---|---|---|---|
1 | Ashburn | United States | 5808 |
2 | Portland | United States | 5130 |
3 | Singapore | Singapore | 3914 |
4 | Frankfurt am Main | Germany | 3908 |
5 | Beijing | China | 3906 |
6 | London | United Kingdom | 3685 |
7 | Columbus | United States | 3672 |
8 | Mumbai | India | 3637 |
9 | Dublin | Ireland | 3631 |
10 | Tokyo | Japan | 3620 |
11 | Sydney | Australia | 3487 |
12 | Paris | France | 3175 |
13 | San Jose | United States | 2815 |
14 | Sao Paulo | Brazil | 2753 |
15 | Cape Town | South Africa | 2692 |
16 | Montreal | Canada | 2535 |
17 | Seattle | United States | 2534 |
18 | Hangzhou | China | 2447 |
19 | Seoul | South Korea | 2327 |
20 | Osaka | Japan | 2184 |
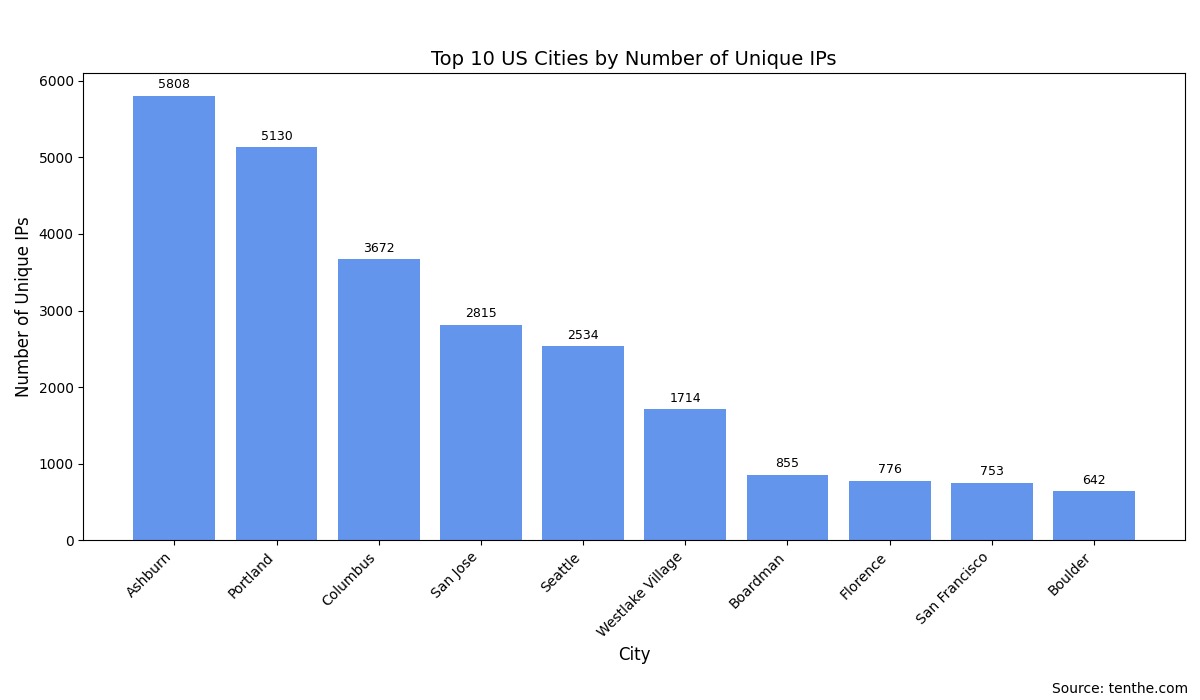
5.3 Top 10 US City Distribution
Rank | City | Unique IP Count |
|---|---|---|
1 | Ashburn | 5808 |
2 | Portland | 5130 |
3 | Columbus | 3672 |
4 | San Jose | 2815 |
5 | Seattle | 2534 |
6 | Westlake Village | 1714 |
7 | Boardman | 855 |
8 | Florence | 776 |
9 | San Francisco | 753 |
10 | Boulder | 642 |
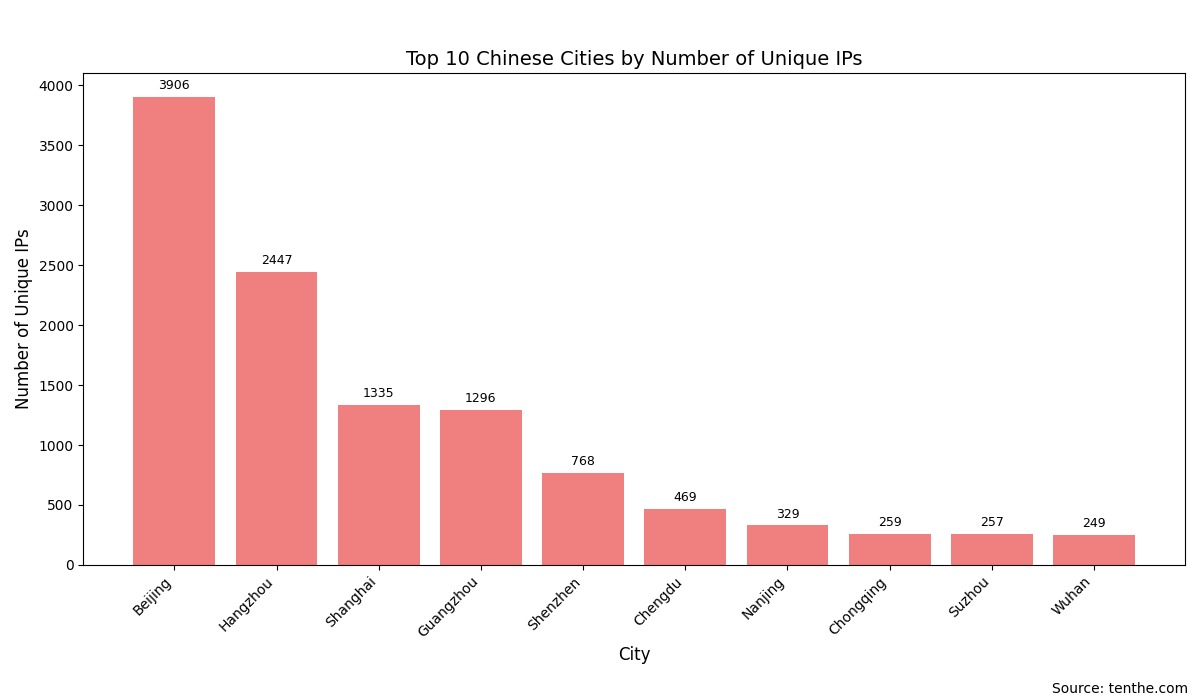
5.4 Top 10 Mainland China City Distribution
Deployments in Hong Kong SAR and Taiwan, China are not reflected in this Top 10 cities table as their aggregates are included in the country/region-level statistics.
Rank | City | Country ( | Unique IP Count |
|---|---|---|---|
1 | Beijing | China | 3906 |
2 | Hangzhou | China | 2447 |
3 | Shanghai | China | 1335 |
4 | Guangzhou | China | 1296 |
5 | Shenzhen | China | 768 |
6 | Chengdu | China | 469 |
7 | Nanjing | China | 329 |
8 | Chongqing | China | 259 |
9 | Suzhou | China | 257 |
10 | Wuhan | China | 249 |
5.5 US-China Top 10 City Deployment Comparison
To facilitate a more direct comparison of Ollama deployment densities at the municipal level between the US and China, the table below juxtaposes the unique IP deployment counts for the top 10 cities in both nations:
Rank | US City (Top 10) | US Unique IP Count | China City (Top 10) | China Unique IP Count |
|---|---|---|---|---|
1 | Ashburn | 5808 | Beijing | 3906 |
2 | Portland | 5130 | Hangzhou | 2447 |
3 | Columbus | 3672 | Shanghai | 1335 |
4 | San Jose | 2815 | Guangzhou | 1296 |
5 | Seattle | 2534 | Shenzhen | 768 |
6 | Westlake Village | 1714 | Chengdu | 469 |
7 | Boardman | 855 | Nanjing | 329 |
8 | Florence | 776 | Chongqing | 259 |
9 | San Francisco | 753 | Suzhou | 257 |
10 | Boulder | 642 | Wuhan | 249 |

Brief Analysis:
Leading City Deployment Volume: The top 3 US cities (Ashburn, Portland, Columbus) each exhibit over 3,000 unique IPs with Ollama deployments. China's foremost city (Beijing) exceeds 3,000 deployments, with its second city (Hangzhou) surpassing 2,000.
Technology and Economic Hubs: A significant number of the listed cities in both countries are recognized technology innovation centers or key economic regions.
Data Center Proximity: The inclusion of US cities such as Ashburn indicates a significant deployment footprint within cloud provider infrastructure and data centers.
Distribution Disparities: Cumulatively, the total IP count in the US Top 10 cities is substantially higher than in China's Top 10. However, both nations demonstrate a pattern where a few core urban centers account for the majority of Ollama deployments.
This city-level comparative analysis further indicates that the adoption of Ollama, as a developer-centric tool, correlates strongly with regional tech ecosystems and industry maturation.
6. Model Analysis
6.1 Overview of AI Models, Parameters, and Quantization
Ollama supports a diverse array of open-source Large Language Models. These models are typically differentiated by the following characteristics:
6.1.1 Common Model Families
The current open-source landscape features a proliferation of prominent LLM families, each with distinct attributes:
Llama Series (Meta AI): e.g., Llama 2, Llama 3, Code Llama. Renowned for robust general-purpose capabilities and extensive community support, fostering numerous fine-tuned derivatives. Models such as
llama3.1,hermes3identified in our dataset are often Llama-architecture based.Mistral Series (Mistral AI): e.g., Mistral 7B, Mixtral 8x7B. Notable for efficiency and high performance benchmarks, particularly its Mixture of Experts (MoE) architectures.
Gemma Series (Google): e.g., Gemma 2B, Gemma 7B. Open-weight models released by Google, leveraging technology from their more powerful Gemini model series.
Phi Series (Microsoft): e.g., Phi-2, Phi-3. Focuses on compact yet performant models, emphasizing "Small Language Models (SLMs)".
DeepSeek Series (DeepSeek AI): e.g., DeepSeek Coder, DeepSeek LLM. PRC-developed AI models demonstrating strong capabilities in code generation and general-purpose tasks.
Qwen Series (Alibaba Tongyi Qianwen): e.g., Qwen1.5. A model series from Alibaba DAMO Academy, supporting multiple languages and tasks.
Numerous other notable models exist, including Yi (01.AI), Command R (Cohere), etc.
Ollama, via its Modelfile abstraction, enables users to readily utilize these base models or their fine-tuned variants. Model identifiers often adhere to the family:size-variant-quantization convention, e.g., llama3:8b-instruct-q4_K_M.
6.1.2 Model Parameters (Parameter Size)
The number of model parameters (typically denoted in Billions 'B' or Millions 'M') is a key indicator of a model's scale and potential capability. Common parameter sizes include:
Small Models: < 7B (e.g., 1.5B, 2B, 3B). Characterized by fast inference and low resource demands, suitable for specialized tasks or resource-constrained environments.
Medium Models: 7B, 8B, 13B. Offer a compelling balance between computational capability and resource demands, representing a highly popular segment within the community.
Large Models: 30B, 33B, 40B, 70B+. Generally exhibit superior capabilities but necessitate greater computational resources (RAM, VRAM) and entail longer inference latencies.
The parameter_size field in our dataset (e.g., "8.0B", "7B", "134.52M") quantifies this attribute.
6.1.3 Quantization Versions (Quantization Level)
Quantization is a technique employed to reduce model footprint and accelerate inference by lowering the numerical precision of model weights (e.g., from 16-bit floating-point FP16 to 4-bit integer INT4).
Prevalent Quantization Schemes: Ollama and the GGUF format (leveraged by Llama.cpp) support various quantization strategies, such as
Q2_K,Q3_K_S,Q3_K_M,Q3_K_L,Q4_0,Q4_K_M,Q5_K_M,Q6_K,Q8_0.The numerical prefix (e.g., 2, 3, 4, 5, 6, 8) generally indicates the bit precision.
K-series quantization (e.g.,Q4_K_M) represents enhanced quantization methods introduced in llama.cpp, typically achieving superior performance at equivalent bit depths._S,_M,_Lsuffixes usually denote K-quant variants affecting different model components.F16(FP16) signifies 16-bit floating-point, often considered unquantized or a baseline quantization.F32(FP32) denotes full precision.
Trade-off: Aggressive quantization (lower bit precision) yields reduced model footprint and inference latency, typically at the cost of some fidelity (model performance degradation). Users must select based on hardware constraints and model quality requisites.
The quantization_level field in our dataset (e.g., "Q4_K_M", "F16") specifies this.
6.2 Top Popular Model Names
The table below lists the Top 10 model tags ranked by unique IP deployments, including their associated family, parameter size, and quantization level metadata.
Rank | Model Name (model_name) | Unique IP Deployments | Total Deployment Instances |
|---|---|---|---|
1 |
| 12659 | 24628 |
2 |
| 12572 | 24578 |
3 |
| 11163 | 22638 |
4 |
| 9868 | 21007 |
5 |
| 9845 | 20980 |
6 |
| 4058 | 5016 |
7 |
| 3124 | 3928 |
8 |
| 2856 | 3372 |
9 |
| 2714 | 3321 |
10 |
| 2668 | 3391 |
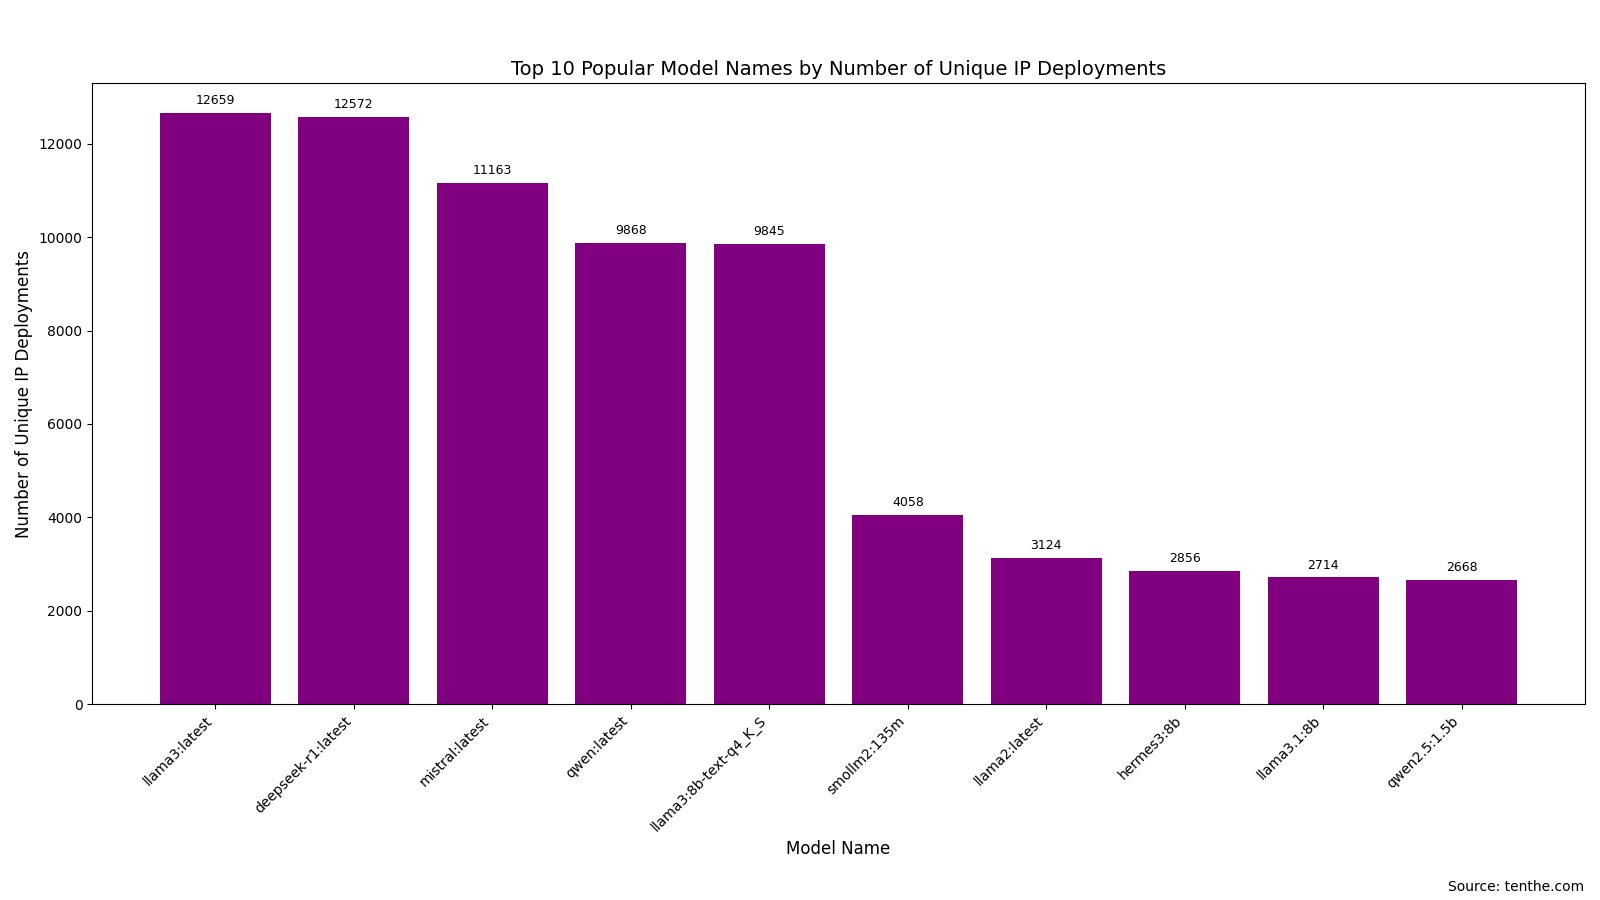
(Note: Unique IP Deployments: Count of unique IP addresses deploying at least one instance of this model tag. Total Deployment Instances: Aggregate count of this model tag across all models lists from all IPs. A single IP may reference the same model tag multiple times via different records or run multiple instances of distinct tags from the same base model.)
Initial Observations (Popular Model Names):
Models tagged with
:latestare highly prevalent (e.g.,llama3:latest,deepseek-r1:latest,mistral:latest,qwen:latest), suggesting a user preference for fetching the most recent model versions.Llama series models (e.g.,
llama3:latest,llama3:8b-text-q4_K_S,llama2:latest,llama3.1:8b) occupy multiple top positions, underscoring their significant adoption.PRC-developed AI models like
deepseek-r1:latest(DeepSeek series) andqwen:latest(Tongyi Qianwen series) also demonstrate substantial adoption, securing high rankings.Specific quantized versions, such as
llama3:8b-text-q4_K_S, feature in the top ten, indicating user selection for specific performance/resource utilization profiles.Compact models like
smollm2:135mandqwen2.5:1.5bshow considerable deployment volume, addressing requirements for resource-constrained or low-latency deployments.
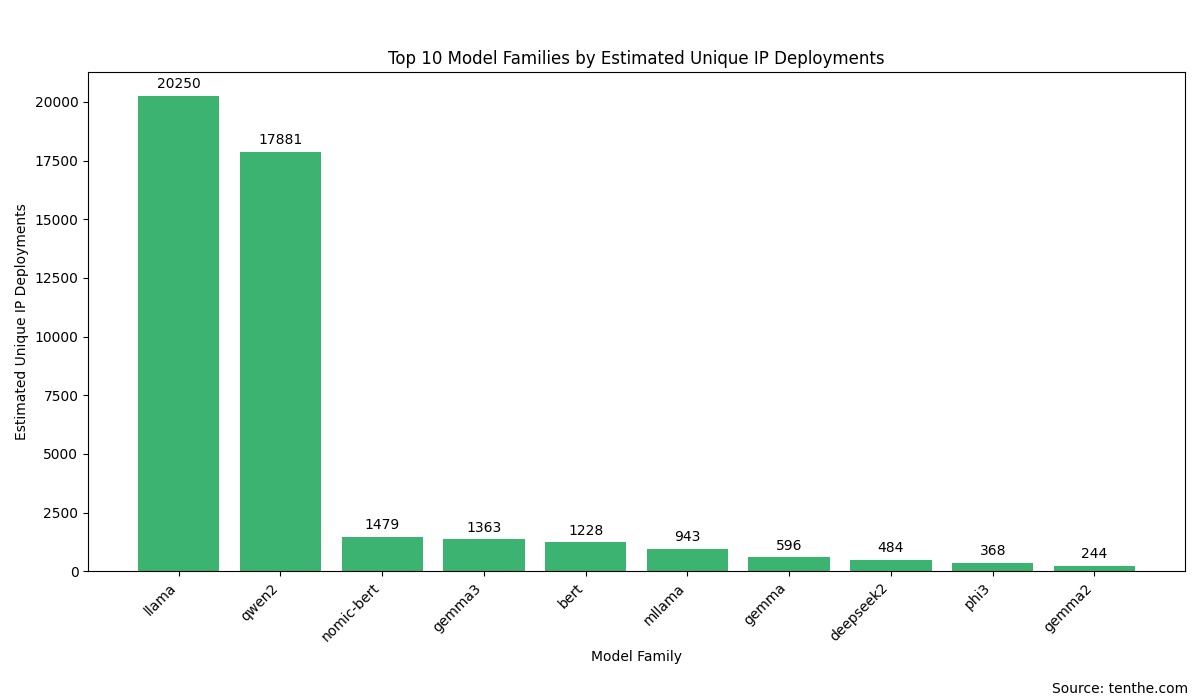
6.3 Top Model Families
Model family (represented by the details.family field) denotes the base architecture or primary technological lineage. The following model families exhibit higher deployment counts based on our data analysis:
Rank | Model Family (family) | Unique IP Deployments (Estimated) | Total Deployment Instances (Estimated) |
|---|---|---|---|
1 |
| ~20250 | ~103480 |
2 |
| ~17881 | ~61452 |
3 |
| ~1479 | ~1714 |
4 |
| ~1363 | ~2493 |
5 |
| ~1228 | ~2217 |
6 |
| ~943 | ~1455 |
7 |
| ~596 | ~750 |
8 |
| ~484 | ~761 |
9 |
| ~368 | ~732 |
10 |
| ~244 | ~680 |
(Note: Figures are estimates summarized from a query of the Top 50 model details and may exhibit slight deviations from precise global aggregates, but trends are representative.)
Initial Observations (Popular Model Families):
The
llamafamily holds a dominant position, consistent with Llama series models serving as foundational architectures for many open-source LLMs and their direct widespread application. Its extensive ecosystem and numerous fine-tuned derivatives solidify its status as the most popular choice.qwen2(Tongyi Qianwen Qwen2 series), as the second largest family, demonstrates strong market competitiveness within China and globally.The presence of
nomic-bertandbertis notable. While not typically classified as conversational LLMs, but rather as text embedding or other foundational NLP models, their high deployment volume indicates Ollama's utility extends to these NLP tasks. Ollama's automatic download of a default embedding model (e.g.,nomic-embed-text) for certain operations (e.g., embedding vector generation) is a primary contributor to their high ranking.Google's
gemmaseries (encompassinggemma3,gemma,gemma2) also shows significant adoption rates.Other prominent model families such as
deepseek2andphi3are present in the top ten.mllamamay represent an aggregation of various Llama-based hybrid, modified, or community-designated models.
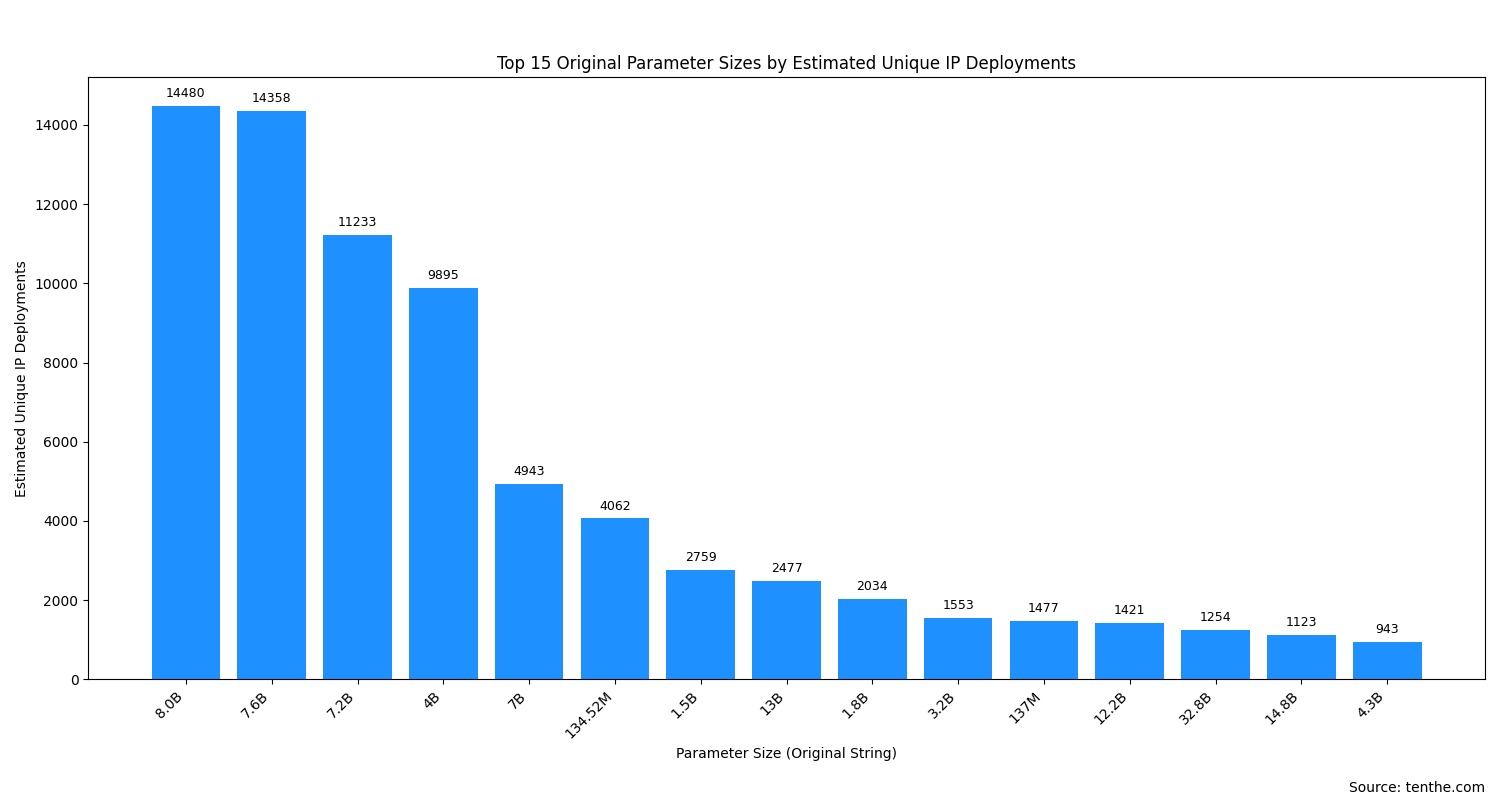
6.4 Top Original Parameter Size Statistics
Model parameter size (details.parameter_size field) is a key metric of model scale. Due to varied string representations of parameter sizes in the raw data (e.g., "8.0B", "7B", "134.52M"), we perform a direct count of these original strings. The following parameter size representations show higher deployment numbers:
Rank | Parameter Size (Original String) | Unique IP Deployments (Estimated) | Total Deployment Instances (Estimated) |
|---|---|---|---|
1 |
| ~14480 | ~52577 |
2 |
| ~14358 | ~28105 |
3 |
| ~11233 | ~22907 |
4 |
| ~9895 | ~21058 |
5 |
| ~4943 | ~11738 |
6 |
| ~4062 | ~5266 |
7 |
| ~2759 | ~3596 |
8 |
| ~2477 | ~3311 |
9 |
| ~2034 | ~2476 |
10 |
| ~1553 | ~2244 |
11 |
| ~1477 | ~1708 |
12 |
| ~1421 | ~2000 |
13 |
| ~1254 | ~2840 |
14 |
| ~1123 | ~2091 |
15 |
| ~943 | ~1194 |
(Note: Values are estimated based on a summary of parameter information from the previously queried Top 50 model details list.)
Initial Observations (Popular Parameter Sizes):
Models in the 7B to 8B parameter range are predominant: "8.0B", "7.6B", "7.2B", "7B" account for the majority of deployments. This typically corresponds to highly popular community models like Llama 2/3 7B/8B series, Mistral 7B, and their various fine-tuned derivatives, which offer a compelling balance between performance and resource demands.
4B scale models also hold a significant share: The high deployment volume of "4B" models is noteworthy.
Million-parameter (M-scale) lightweight models are widely adopted: The high ranking of "134.52M" and "137M" is likely attributable to the popularity of embedding models (e.g.,
nomic-embed-text) or very small specialized models (e.g.,smollmseries). These models are compact, fast, and suitable for resource-constrained or latency-sensitive applications.Consistent demand for small models in the 1B-4B range: Models with parameter sizes such as "1.5B", "1.8B", "3.2B", "4.3B" are adopted by a specific user segment.
Large models exceeding 10B parameters: Models such as "13B", "12.2B", "32.8B", "14.8B", while having fewer unique IP deployments compared to the 7-8B tier, still exhibit considerable deployment volume, indicating community demand for more capable models, despite their increased hardware prerequisites.
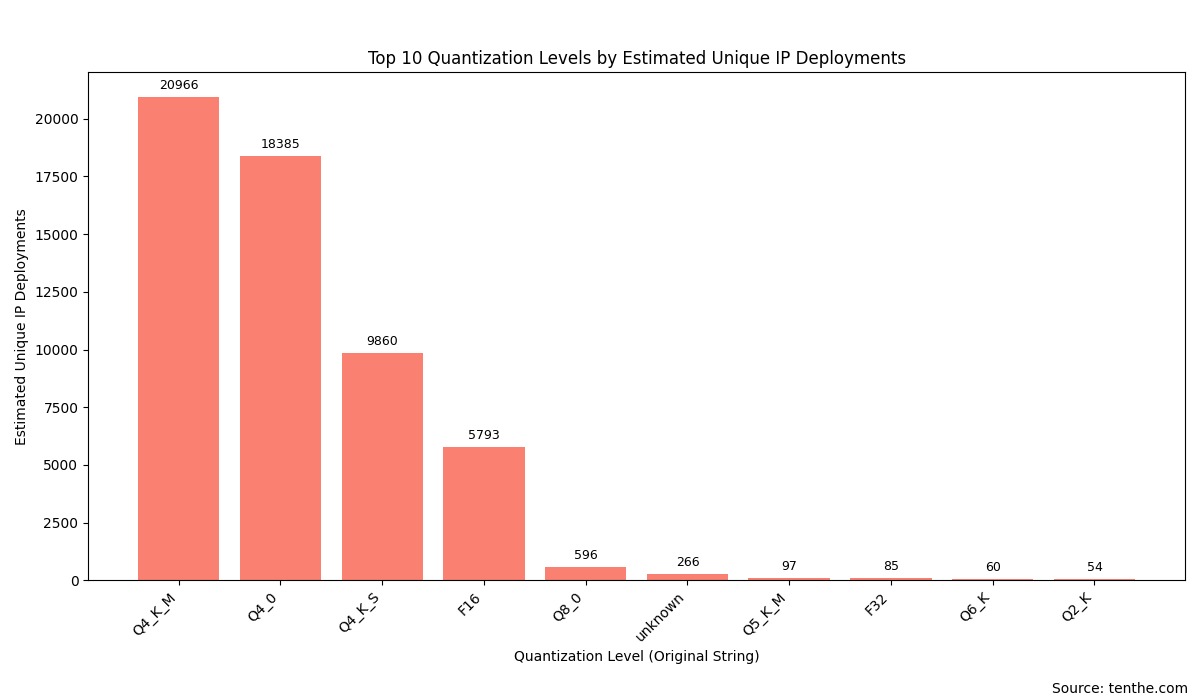
6.5 Top Quantization Level Statistics
Model quantization level (details.quantization_level field) reflects the weight precision adopted to reduce model size and accelerate inference. Below are the quantization levels with higher deployment counts:
Rank | Quantization Level (Original String) | Unique IP Deployments (Estimated) | Total Deployment Instances (Estimated) |
|---|---|---|---|
1 |
| ~20966 | ~53688 |
2 |
| ~18385 | ~88653 |
3 |
| ~9860 | ~21028 |
4 |
| ~5793 | ~9837 |
5 |
| ~596 | ~1574 |
6 |
| ~266 | ~1318 |
7 |
| ~97 | ~283 |
8 |
| ~85 | ~100 |
9 |
| ~60 | ~178 |
10 |
| ~54 | ~140 |
(Note: Values are estimated based on a summary of quantization information from the previously queried Top 50 model details list.)
Initial Observations (Popular Quantization Levels):
4-bit quantization is the dominant strategy:
Q4_K_M,Q4_0, andQ4_K_S, these three 4-bit quantization schemes, dominate the deployment statistics. This clearly indicates widespread community adoption of 4-bit quantization as the preferred strategy for optimizing the balance between model performance, inference speed, and resource footprint (particularly VRAM).F16(16-bit floating-point) maintains a significant presence: As an unquantized (or minimally quantized) version, the high deployment ofF16suggests a considerable user base prioritizing maximum model fidelity or possessing adequate hardware resources.Q8_0(8-bit quantization) serves as a supplementary option: It offers an intermediate option between 4-bit and FP16 precision.Presence of
unknownvalues: Indicates missing or non-standardized entries in model metadata for quantization level.
6.6 Distribution of AI Compute Capacity (by Model Parameter Size): China vs. USA
To provide a granular analysis of how models of varying scales are deployed in major countries, we categorized and aggregated the parameter sizes of models deployed on Ollama instances in the United States and China. Parameter size is often used as a key proxy for model complexity and requisite AI compute capacity.
Parameter Scale Classification Schema:
Small: < 1 Billion parameters (< 1B)
Medium: 1 Billion to < 10 Billion parameters (1B to < 10B)
Large: 10 Billion to < 50 Billion parameters (10B to < 50B)
Extra Large: >= 50 Billion parameters (>= 50B)
The table below details the number of unique IPs deploying models of different parameter scales in the US and China:
Country | Parameter Scale Category | Unique IP Count |
|---|---|---|
China | Small (<1B) | 3313 |
China | Medium (1B to <10B) | 4481 |
China | Large (10B to <50B) | 1548 |
China | Extra Large (>=50B) | 280 |
United States | Small (<1B) | 1368 |
United States | Medium (1B to <10B) | 6495 |
United States | Large (10B to <50B) | 1301 |
United States | Extra Large (>=50B) | 58 |
--China-vs-USA.jpeg)
Data Insights and Analysis:
Medium-sized models are mainstream, with differing strategic emphases:
United States: Deployments of medium-sized models (1B-10B) are absolutely dominant in the US (6495 unique IPs).
China: Medium-sized models (4481 unique IPs) are also the most deployed category in China; however, the deployment of small models (<1B) in China (3313 unique IPs) is very substantial.
Notable divergence in small model deployments: China's extensive deployment of small models may reflect a strategic focus on edge AI, mobile-first AI applications, and analogous use-cases.
Deployment of large and extra-large models: China exhibits greater exploratory activity with large and extra-large models, albeit from a smaller deployment baseline relative to medium models.
Implications for overall AI compute investment: The US concentration in medium-sized models indicates a mature adoption phase focused on practical AI applications. China demonstrates a strong position in small model deployments and active exploration of larger model architectures.
Implications for global trends: Medium-sized models are likely popular globally. Regional model adoption strategies likely diverge based on local ecosystem maturity and resource availability.
This segmented analysis of model parameter scales in China and the US reveals distinct strategic focuses and development trajectories for Ollama applications in these two key regions.
7. Network Insights
7.1 Port Usage
11434(default port): The predominant deployment configuration (30,722 unique IPs) utilizes the default port11434for Ollama instances.Other common ports: Ports such as
80(1,619 unique IPs),8080(1,571 unique IPs),443(1,339 unique IPs), etc., are also utilized, which may suggest deployment behind reverse proxies or user-configured port assignments.
7.2 Protocol Usage
HTTP: Approximately 65,506 unique IPs host instances serving via the HTTP protocol.
HTTPS: Approximately 43,765 unique IPs host instances serving via the HTTPS protocol.
A majority of instances remain exposed over unencrypted HTTP, presenting potential security vulnerabilities. (Note: A single IP may support both HTTP and HTTPS, thus the sum of IP counts may exceed the total unique IP count.)
7.3 Main Hosting Providers (AS Organization)
Ollama instance hosting exhibits a high concentration within major Cloud Service Provider (CSP) networks and telecommunications infrastructure.
Rank | AS Organization | Unique IP Count | Main Associated Provider |
|---|---|---|---|
1 | AMAZON-02 | 53658 | AWS |
2 | AMAZON-AES | 5539 | AWS |
3 | Chinanet | 4964 | China Telecom |
4 | Hangzhou Alibaba Advertising Co.,Ltd. | 2647 | Alibaba Cloud |
5 | HENGTONG-IDC-LLC | 2391 | Hosting Provider |
6 | Shenzhen Tencent Computer Systems Company Limited | 1682 | Tencent Cloud |
7 | CHINA UNICOM China169 Backbone | 1606 | China Unicom |
8 | Hetzner Online GmbH | 972 | Hetzner |
9 | China Unicom Beijing Province Network | 746 | China Unicom (Beijing) |
10 | LEASEWEB-USA-LAX | 735 | Leaseweb |
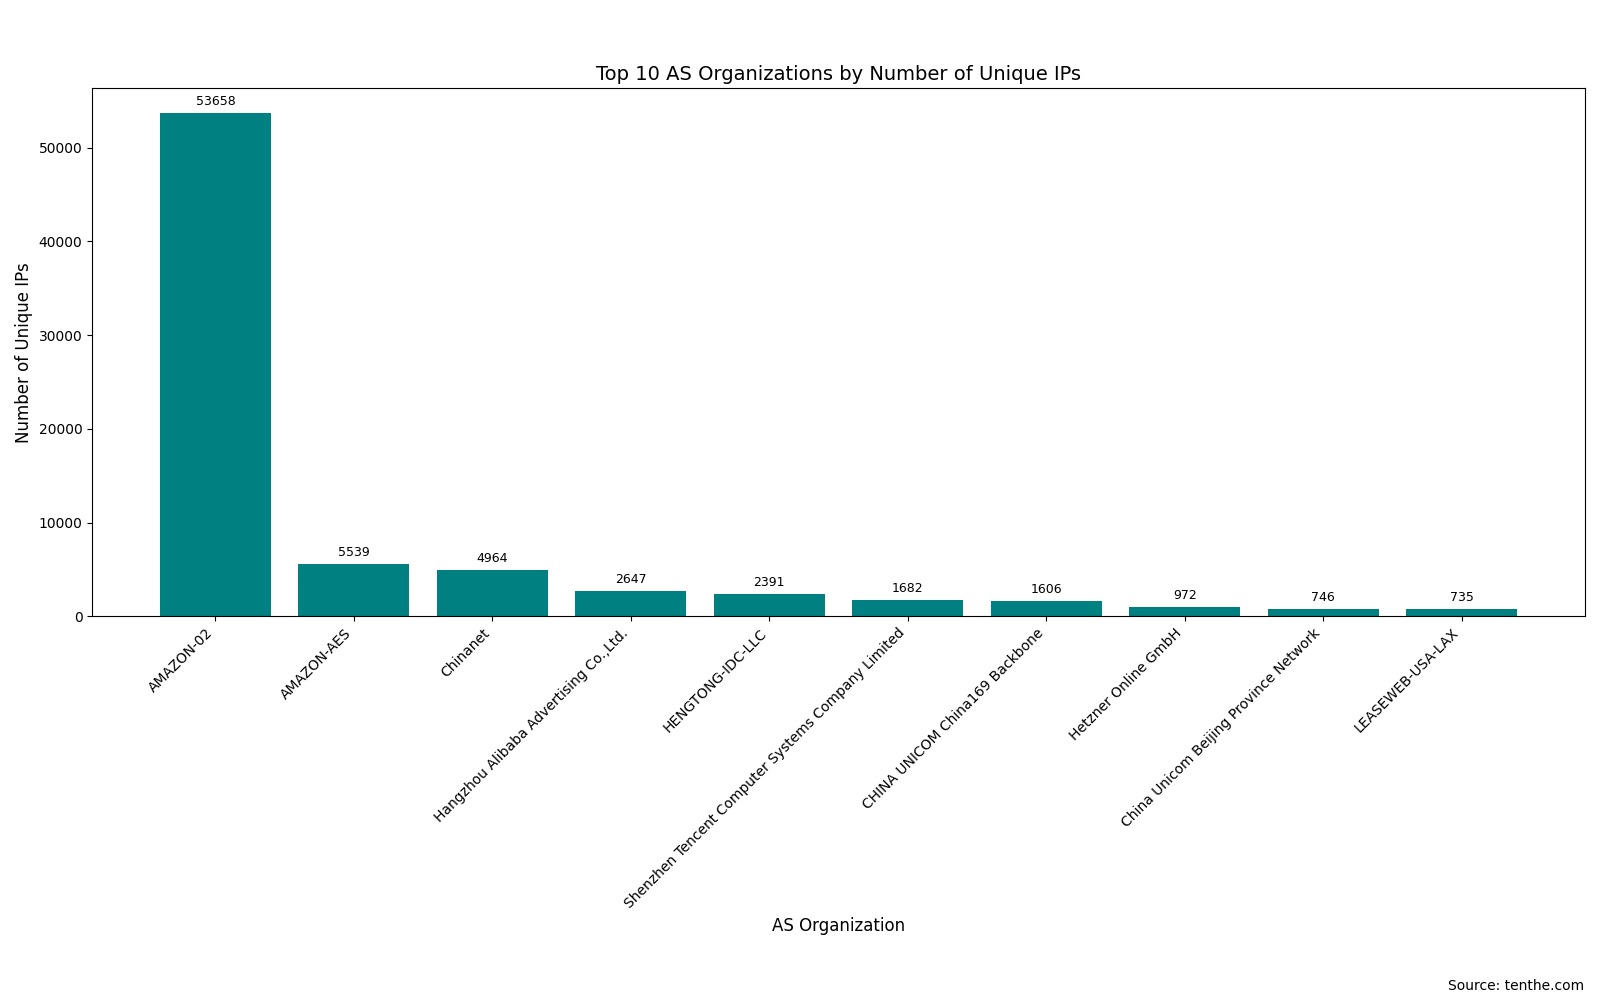
AWS (AMAZON-02, AMAZON-AES) commands the largest market share, followed by major Chinese telecommunications operators and CSPs (e.g., Alibaba Cloud, Tencent Cloud). Other hosting providers like Hetzner and Leaseweb also maintain significant shares.
8. Security and Other Observations
Version Information: Ollama version statistics are omitted from this report due to security considerations.
HTTP Exposure Risk: As previously noted, a large number of Ollama instances are exposed via HTTP without TLS encryption. This renders communication payloads (e.g., model interactions) susceptible to interception or modification. Implementation of a reverse proxy with HTTPS/TLS termination is strongly recommended.
API Accessibility: The data in this report is predicated on Ollama instances with publicly accessible
/api/tagsendpoints. The true deployment count is potentially higher, as some instances may reside within private networks or have ingress access restricted by firewall policies.
9. Conclusion and Brief Review
This report, by analyzing data from 99,412 globally publicly accessible Ollama instances (via their /api/tags interface), yields the following key conclusions and observations:
1. Global Deployment Overview and Geographical Distribution:
Ollama, as a streamlined utility for local LLM execution, has achieved widespread global deployment. This analysis identified 99,412 publicly accessible unique IPs.
Significant Geo-Concentration: The United States and China are the two countries/regions with the most concentrated Ollama deployments, collectively representing a substantial share of total accessible instances (US 29,195, China 16,464). Nations like Japan, Germany, the UK, India, and Singapore also exhibit notable deployment figures.
Urban Hotspots: In the US, cities like Ashburn, Portland, and Columbus lead in deployment density. In China, technologically-hub cities such as Beijing, Hangzhou, Shanghai, and Guangzhou are primary deployment loci. This often correlates with concentrations of technology firms, data center infrastructure, and developer ecosystems.
2. AI Model Deployment Trends:
Popular Model Tags: Generic
latesttags such asllama3:latest,deepseek-r1:latest,mistral:latest,qwen:latestexhibit highest popularity. Specifically optimized versions likellama3:8b-text-q4_K_Sare also favored for their optimized balance of performance and resource usage.Dominant Model Families: The
llamafamily demonstrates clear market leadership, followed byqwen2. The high ranking of embedding model families likenomic-bertandbertis noteworthy, potentially attributable to Ollama's default behavior or bootstrapping processes for embedding generation.Parameter Size Preferences: Models with 7B-8B parameters represent the current mainstream adoption. Lightweight models at the million-parameter scale and large models exceeding 10B parameters cater to distinct market segments. A US-China comparison indicates US deployments favor medium-sized models, whereas PRC deployments show greater activity in small and extra-large model categories.
Quantization Level Choices: 4-bit quantization (particularly
Q4_K_MandQ4_0) is the predominant choice.F16, as a higher-fidelity alternative, also maintains an important position.Metadata Complexity: Analysis of model metadata (e.g., interpretation of the
details.familyfield) occasionally reveals discrepancies or ambiguities relative to model names or common understanding, underscoring the heterogeneity in metadata management within the open-source ecosystem.
3. Technical Infrastructure:
Hosting Environments: A significant volume of Ollama instances are hosted within major CSPs like AWS, Alibaba Cloud, Tencent Cloud, and within the networks of major national telecommunications operators.
Service Ports: Ollama's default port
11434is the predominantly utilized configuration, though a considerable number of instances are also exposed via standard web ports (80, 443, 8080).
4. Objective Assessment:
Popularity of Ollama: The data clearly demonstrates Ollama's significant adoption within developer and AI practitioner communities worldwide.
Vitality of the Open-Source Ecosystem: The diversity of popular models and the widespread use of various parameter and quantization versions reflect the rapid evolution of the open-source AI model ecosystem.
User Preference for Balanced Solutions: In model selection, users tend to prioritize a balance between model capability, operational efficiency, and TCO/hardware expenditure.
Security Considerations and Openness: A large number of instances permit public access to their model lists which, while beneficial for community accessibility, also introduces potential security exposures.
5. Future Outlook:
The proliferation of more efficient, compact models and advancements in quantization techniques are anticipated to further lower the barrier to Ollama deployment.
Standardization of model metadata and community-driven model sharing initiatives are pivotal for enhancing ecosystem transparency and usability.
In summary, Ollama is emerging as a key enabler, bridging advanced Large Language Models with a diverse user base of developers, researchers, and end-users. This data analysis provides valuable telemetry for assessing its current global deployment landscape and user adoption patterns.
Commenti
comments.comments (0)
Please login first
Sign in